

My Month with a Virtual User: An Experiment in System Responsiveness
September 10, 2024
I shared my workstation with a virtual user for a month, and frankly, it was a strange experience. Sometimes, during Teams meetings, the virtual user would take control of my mouse and keyboard to assess the system’s responsiveness. Thankfully, with a bit of ingenuity, I managed to avoid looking unprofessional—for the sake of science, of course. Along the way, I made some interesting observations, which I’ll share below.
Key Learnings from the Experiment
Virtual Environments vs. Physical Desktops
Physical desktops often turn their screens off to conserve power and benefit the environment. This doesn’t happen as frequently in virtualized environments. From my experience, when results were displayed in Login Enterprise’s continuous test, the EUX score would register a “0.”
Why? Because the user interface never fully “creates” while a screen saver is active. Why should it? This leads to the virtual user being unable to complete some of the EUX calculations. While we registered a zero for certain timers, other measurements were still gathered and are shared below.
Mouse Control Challenges
I noticed that sometimes when I competed for mouse control during the user input scoring, it could cause challenges with the collected timer. By monitoring my system for an extended period, I can confidently proclaim I would benefit from additional memory. I typically operated at 80% memory occupancy, and any system changes or additional tasks quickly consumed the remaining overhead.
Application Performance and Visibility Gaps
Interestingly, when my EUX score was particularly high, I sometimes encountered issues with specific applications or parts of my workflow. I implemented additional application workflows to address this, even though I initially resisted. While I was comfortable with Login Enterprise’s virtual user interacting with my system in a limited capacity, I didn’t want it reading my emails or modifying blog posts—like the one you’re reading right now!
The virtual user can recognize applications like Outlook when certain criteria are met. For example, if Outlook is already running, it will attempt to reattach and continue the workflow instead of failing.
Unproven Hypotheses and Early Insights
An interesting pattern emerged during data collection: a noticeable difference between the measured responsiveness of the “My Documents” and “Local Appdata” tests. The interactions were the same, and both data locations were stored on the same physical disk. Yet, there was a clear performance difference.
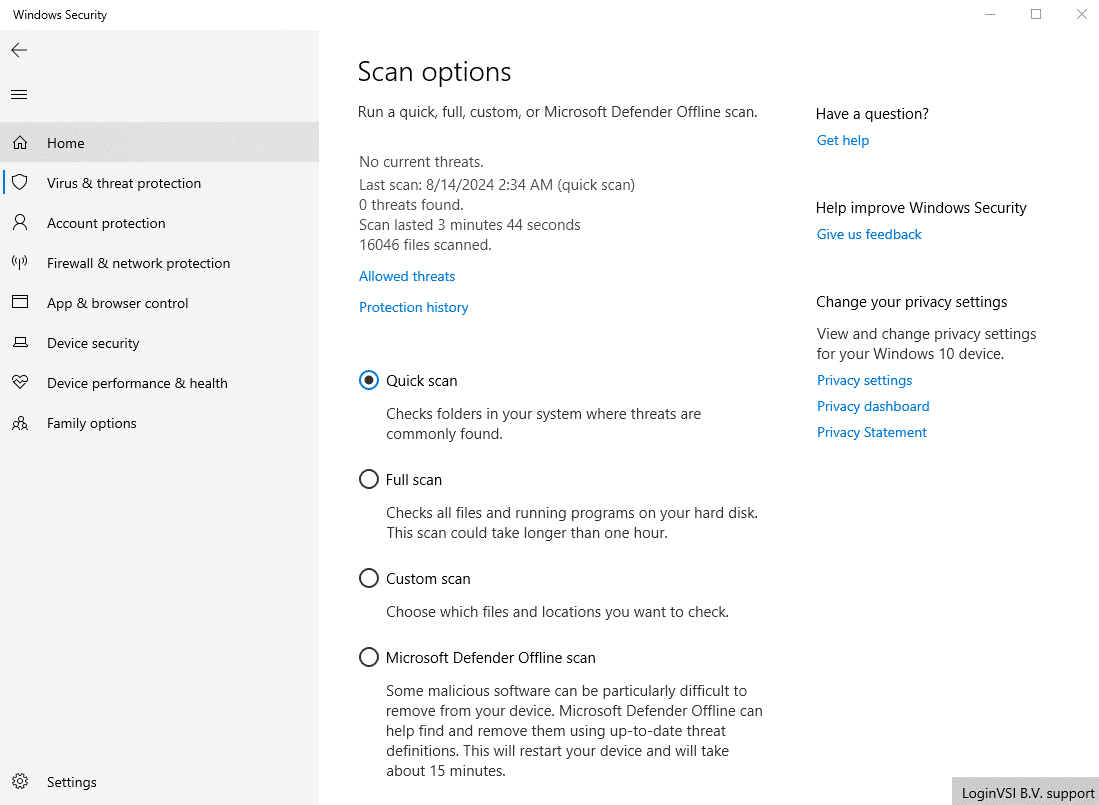
This may be due to antivirus (AV) scanning behaviors in user-oriented storage locations, while general system file locations typically require elevated permissions and are less affected. While this is purely speculative, it could be worth investigating further by gathering more performance counters or process monitoring data.
Experiment Log
Here’s a brief timeline of notable events during the experiment:
- 7/12 – Started running the experiment at 8 p.m. EST. Registered a 9.2 EUX score.
- 7/15 – At 11:33 a.m., I experienced poor user performance. Applications were slow to load, and deleting Outlook messages was painstakingly slow. The task manager also took a while to open. Despite this, the EUX score remained 9.2. This highlights the importance of monitoring specific applications rather than relying solely on overall system data.
- 7/16 – At 12:58 p.m., I launched EUX while recording a video with Nick. The machine’s performance seemed fine, but I wondered how resource availability affected EUX task responses.
- 7/24 – This week and next, I’ll be traveling and not always plugged in, so some EUX scores may reflect my laptop running in balanced power mode instead of performance mode.
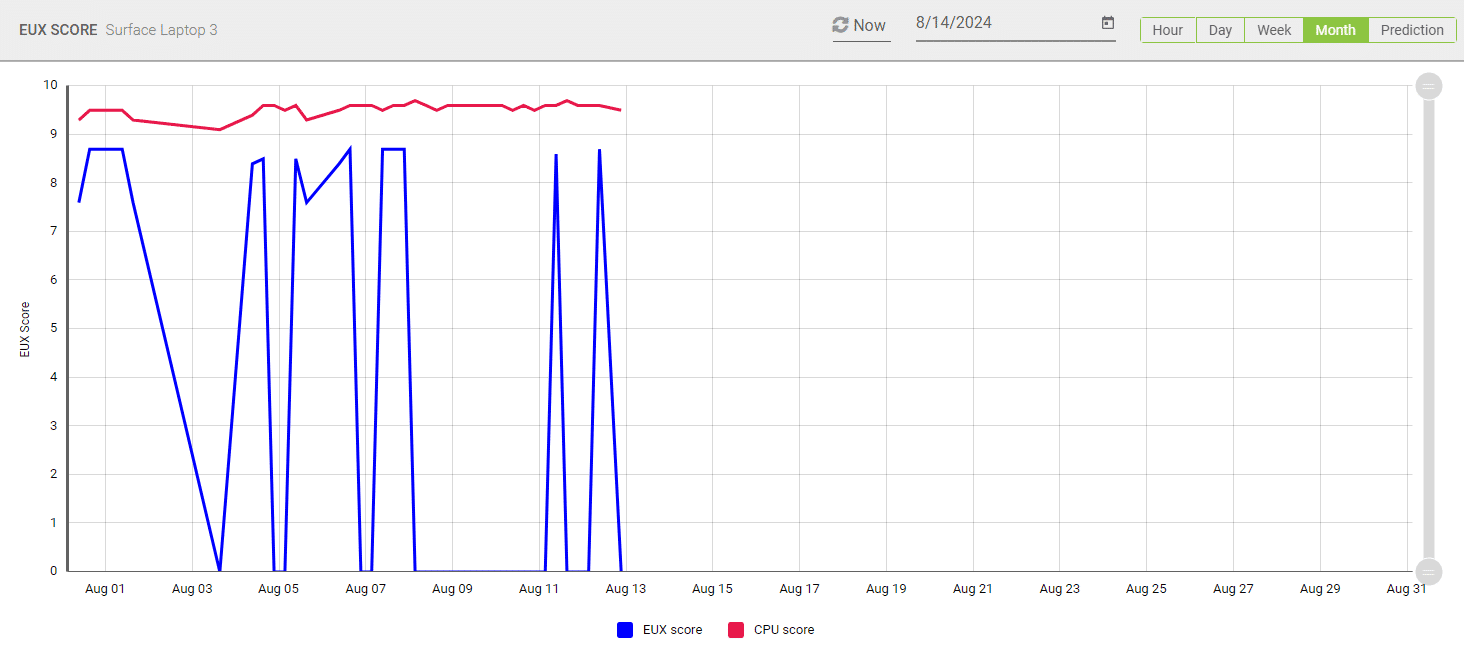
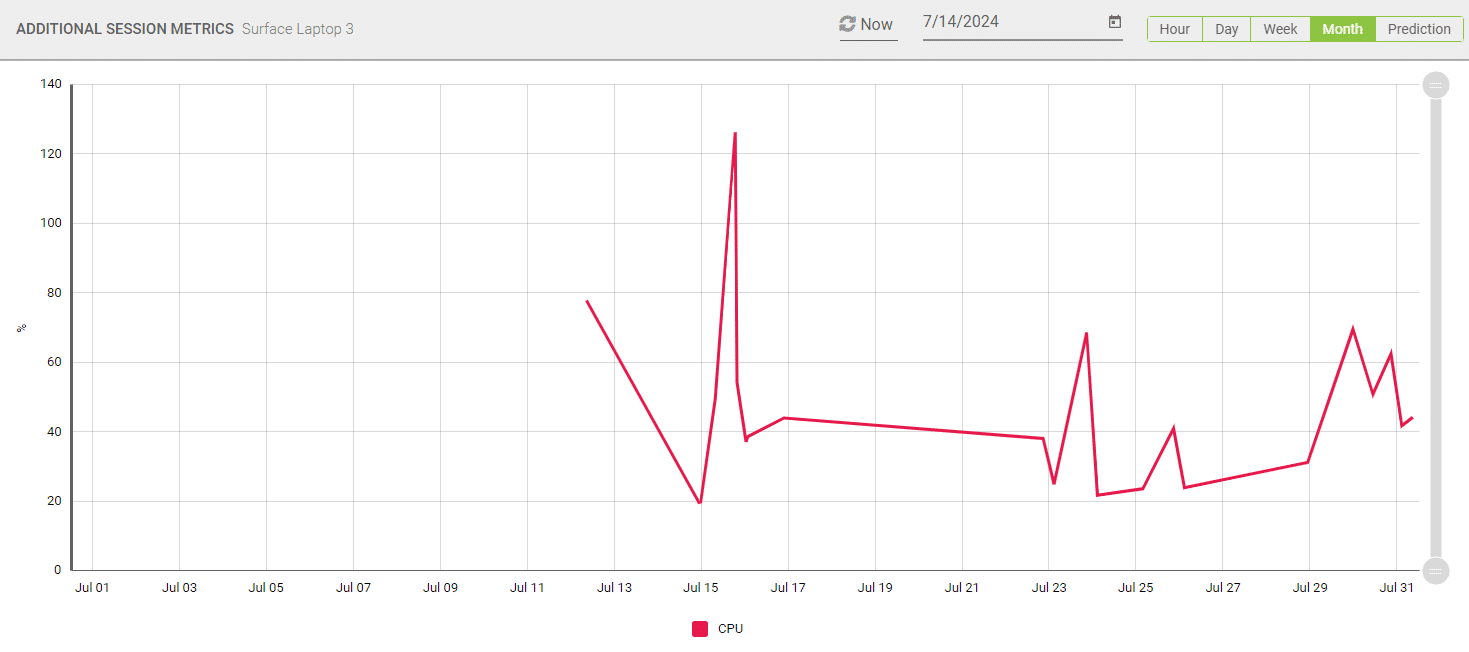
Figure 1. CPU utilization percentages in July indicate that during the execution of the virtual user workload, you would see, on average, around 40% utilization.
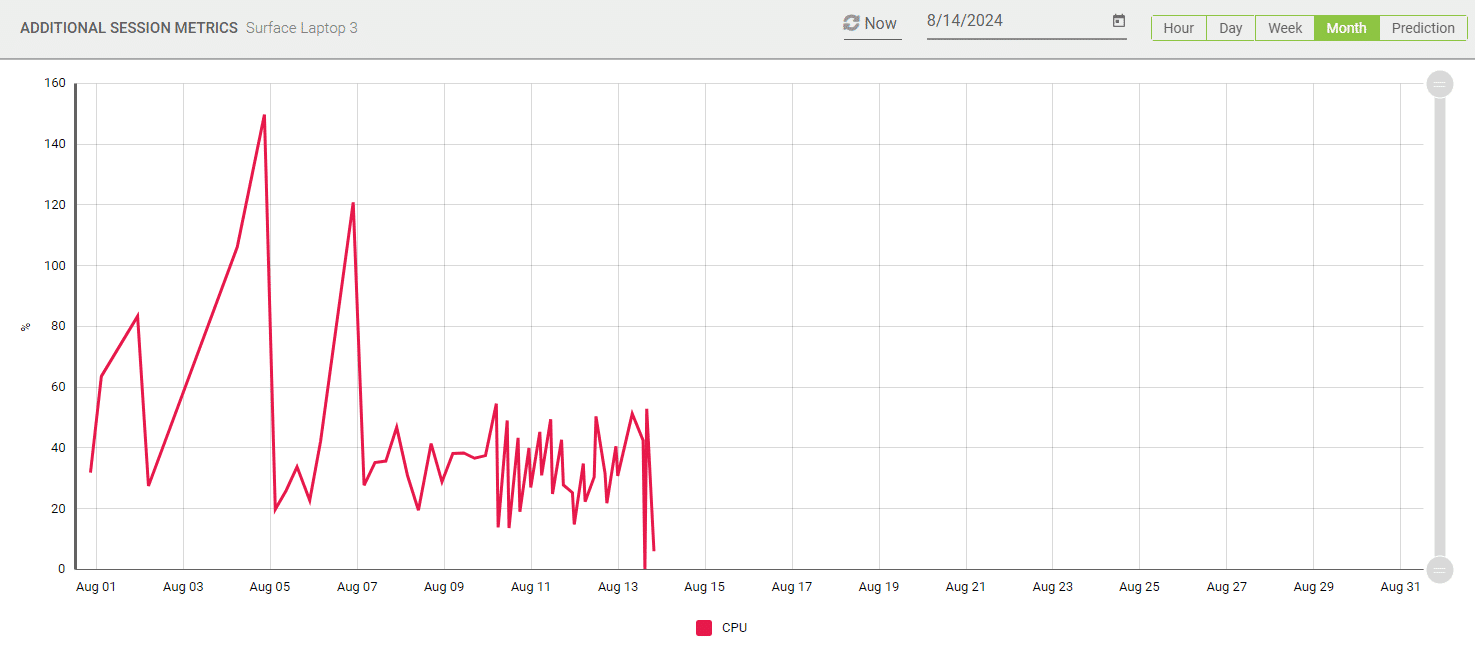
Figure 2. We follow a similar pattern in August. However, at the beginning of August, you see a few periods of elevated processor utilization %.
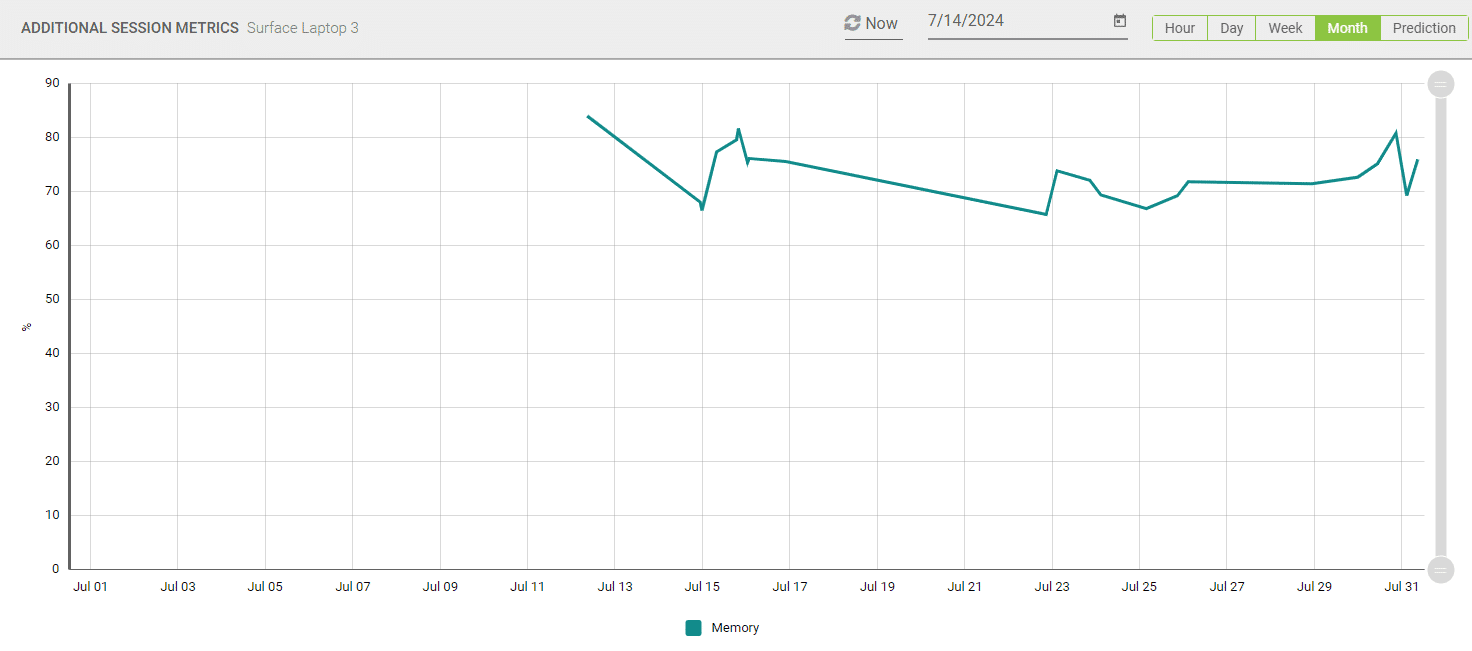
Figure 3. The pattern of memory utilization is that, on average, around 70% of the system’s memory was occupied at the time of virtual user execution during July.
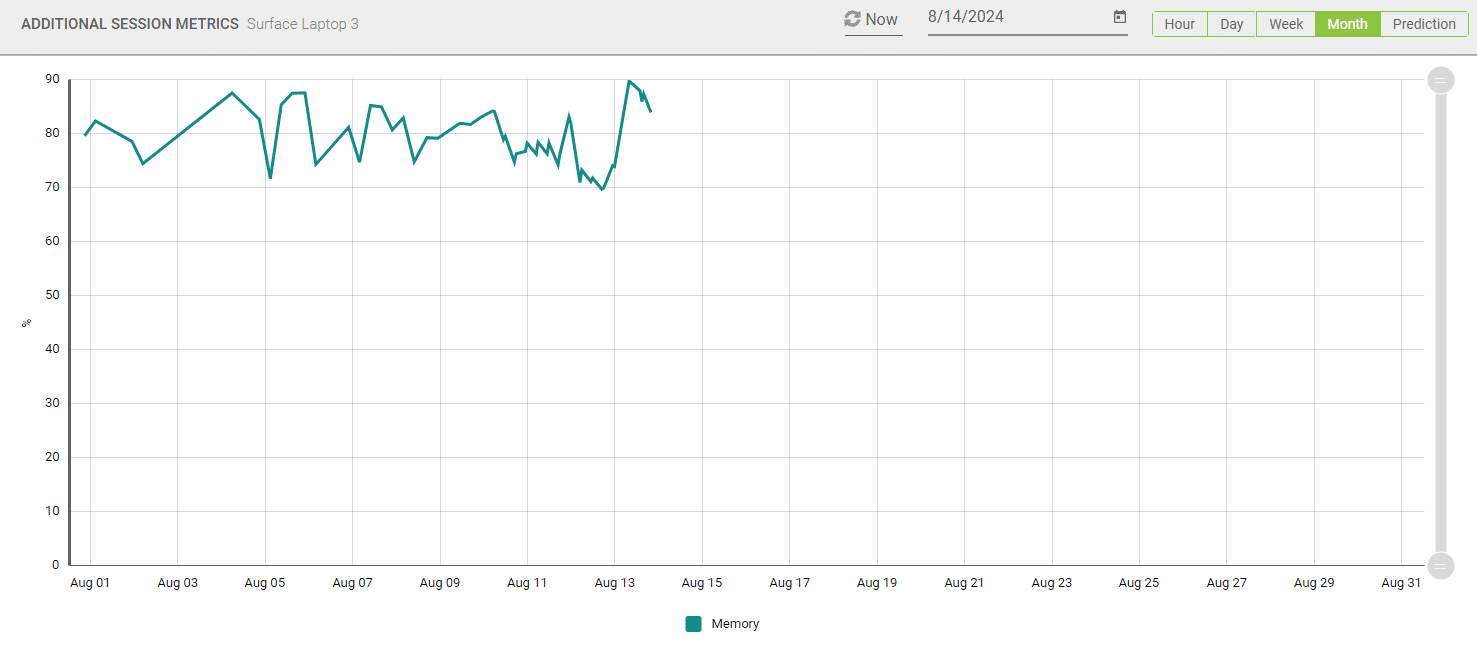
Figure 4. Looking at August data shows that, on average, 10 – 15% more memory occupied at time execution. This indicates a reduction of available memory overhead.
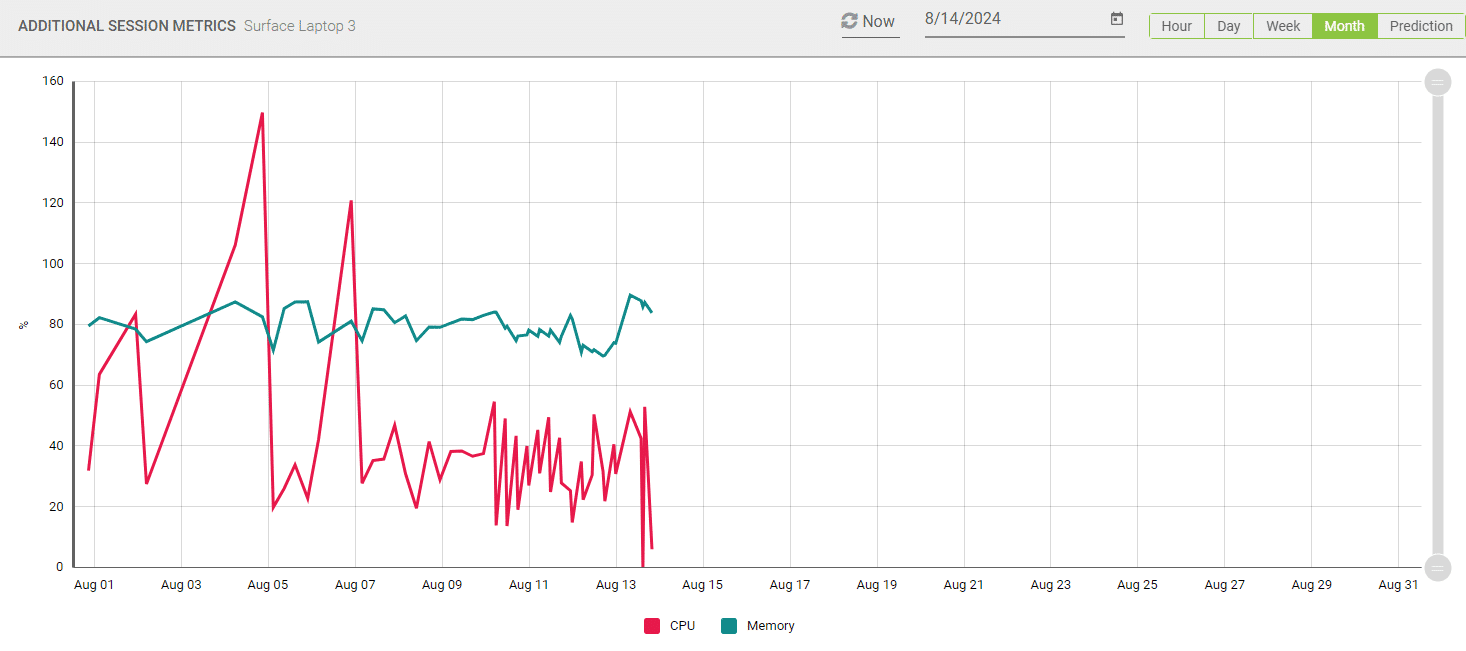

Figure 5. The CPU metric was collected while I was in the middle of a Teams meeting and presenting.
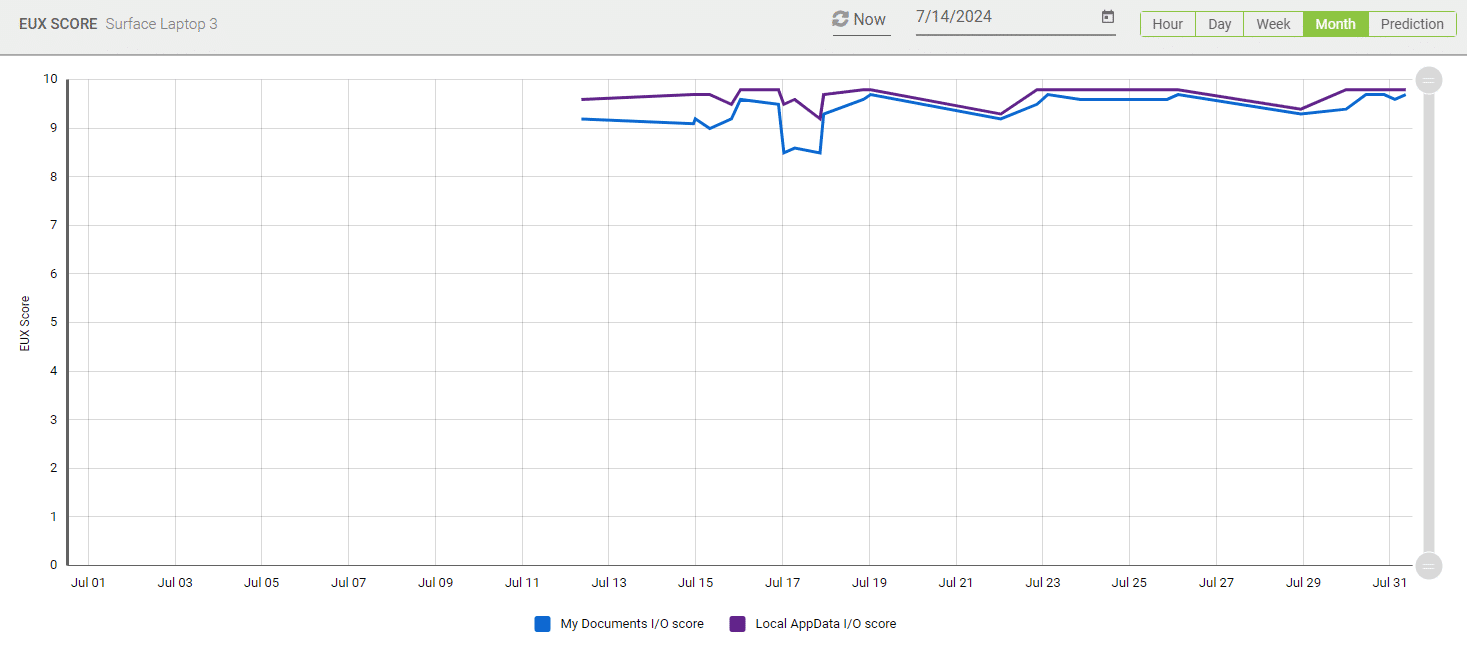
Figure 6. You’ll notice a growth in the gap between My Documents and Local AppData I/O scores. This is interesting. Seems whatever is causing the deviation (as the behavior is the exact same) is growing. As a note, this machine is running OneDrive and synchronizing the contents with Microsoft. AV software which is running is Windows Defender –
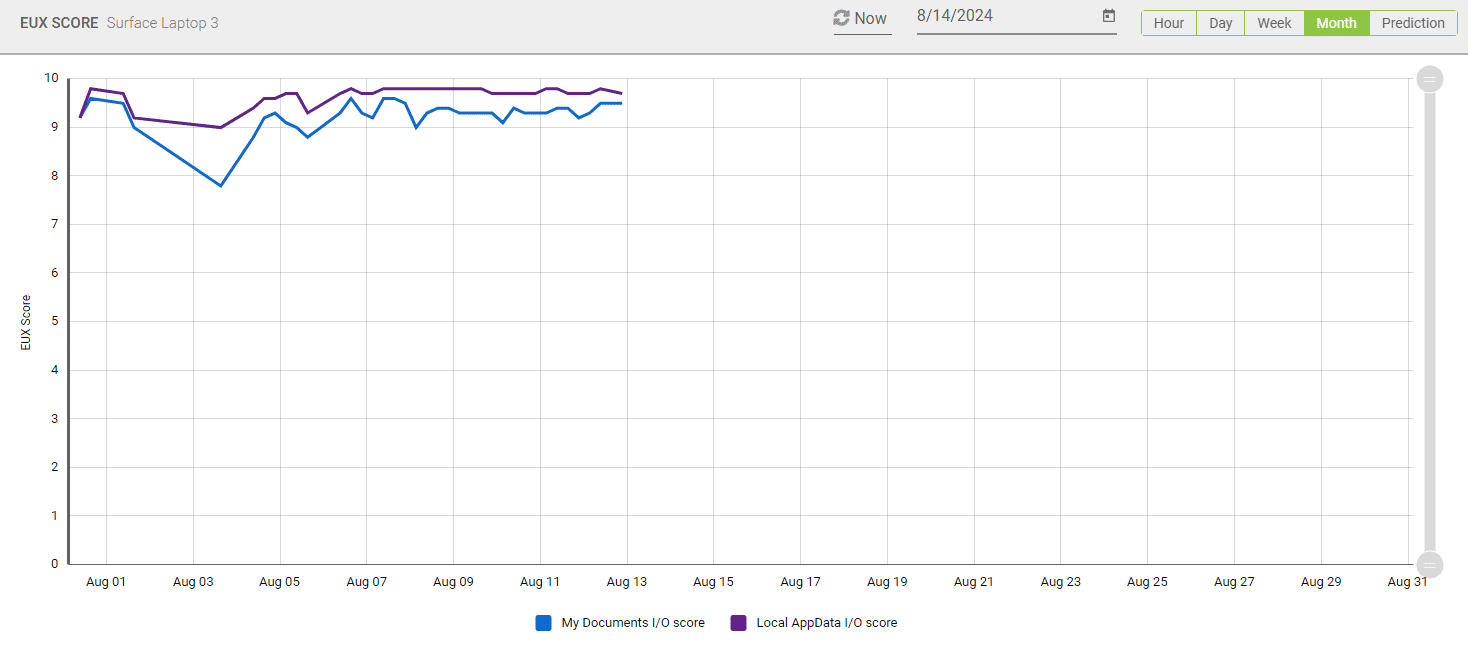
Figure 7. Speculation about the difference in performance is related to OS operations or AV operations against user storage locations vs. OS.
Final Observation
Overall, the virtual user worked fairly well, aside from occasional interruptions. However, I learned that trying to “steal” focus from the virtual user during data gathering could disrupt the process of determining application performance measures.
In conclusion, this experiment revealed the potential benefits and challenges of sharing a workstation with a virtual user. While it led to valuable insights, it also raised questions about system resources and performance visibility that warrant further investigation.
Endpoints PerformanceEUX ScoreGPU


