Login Enterprise 5.11: Compare 5 Load Test Results
July 11, 2024
With the release of Login Enterprise 5.11, we’re excited to introduce a powerful new feature that significantly enhances your ability to compare load tests. You can now compare up to five load tests simultaneously within our web interface, offering more flexibility and detailed analysis than ever before. Whether you’re making incremental changes, conducting periodic tests, or optimizing configurations for cost and performance, this new feature is designed to provide you with deeper insights and more efficient testing workflows.
Business Benefits, Value, and Use Cases
- Track Incremental Changes: The ability to track incremental changes, such as OS updates, security updates, and software installations and updates. By using detailed titles and comments in load test runs, you can easily document specific changes and test bed specifications. This enables accurate side-by-side comparisons, allowing for objective and faster decision-making and validation. Now you can quickly assess the impact of each change, streamlining the process and improving efficiency.
- Perform Long-Term Comparisons: Perform objective long-term comparisons. If updates occur quarterly, it can be easy to forget previous test outcomes. By comparing these results, you can identify performance trends over time, helping plan future updates more effectively. This ensures consistent performance evaluations and facilitates better long-term planning, maintaining a high standard of system performance year after year.
- Identify Cost-Effective Configurations: Identify the most cost-effective configurations by comparing different SKUs, hardware configurations, or software versions. By evaluating performance metrics like EUX score and VSImax, you can determine which configurations offer the best performance for the cost. Examples include comparing various versions of Microsoft Office or security software configurations to find the optimal setup. This approach ensures that your production environment remains efficient and compliant with security policies, delivering the best value for your investment.
Setting up:
Configuring Load Test Settings
Setting up a load test begins with configuring the essential settings. Specify parameters such as the number of virtual users, test duration, and performance metrics. These configurations ensure that the test environment accurately simulates real-world conditions.
Adding Applications to a Load Test
Next, add the applications you need to test. This could include productivity suites like Microsoft Office, custom enterprise applications, or any other software critical to your business operations. Ensure all necessary applications are included to obtain comprehensive test results.
Starting a Load Test
Once everything is configured, initiate the load test. Our platform will simulate user interactions and system load, providing valuable data on performance, stability, and user experience under different conditions.
Load Test Comparison and Results
As of version 5.11, you can now select up to five load tests for comparison. This is a significant upgrade from the previous limit of two. Simply select the tests you want to compare and click the “Compare” button.
In this example, I’ve chosen 5 load tests that are interesting and relevant to compare via the checkbox column.
Overview Page
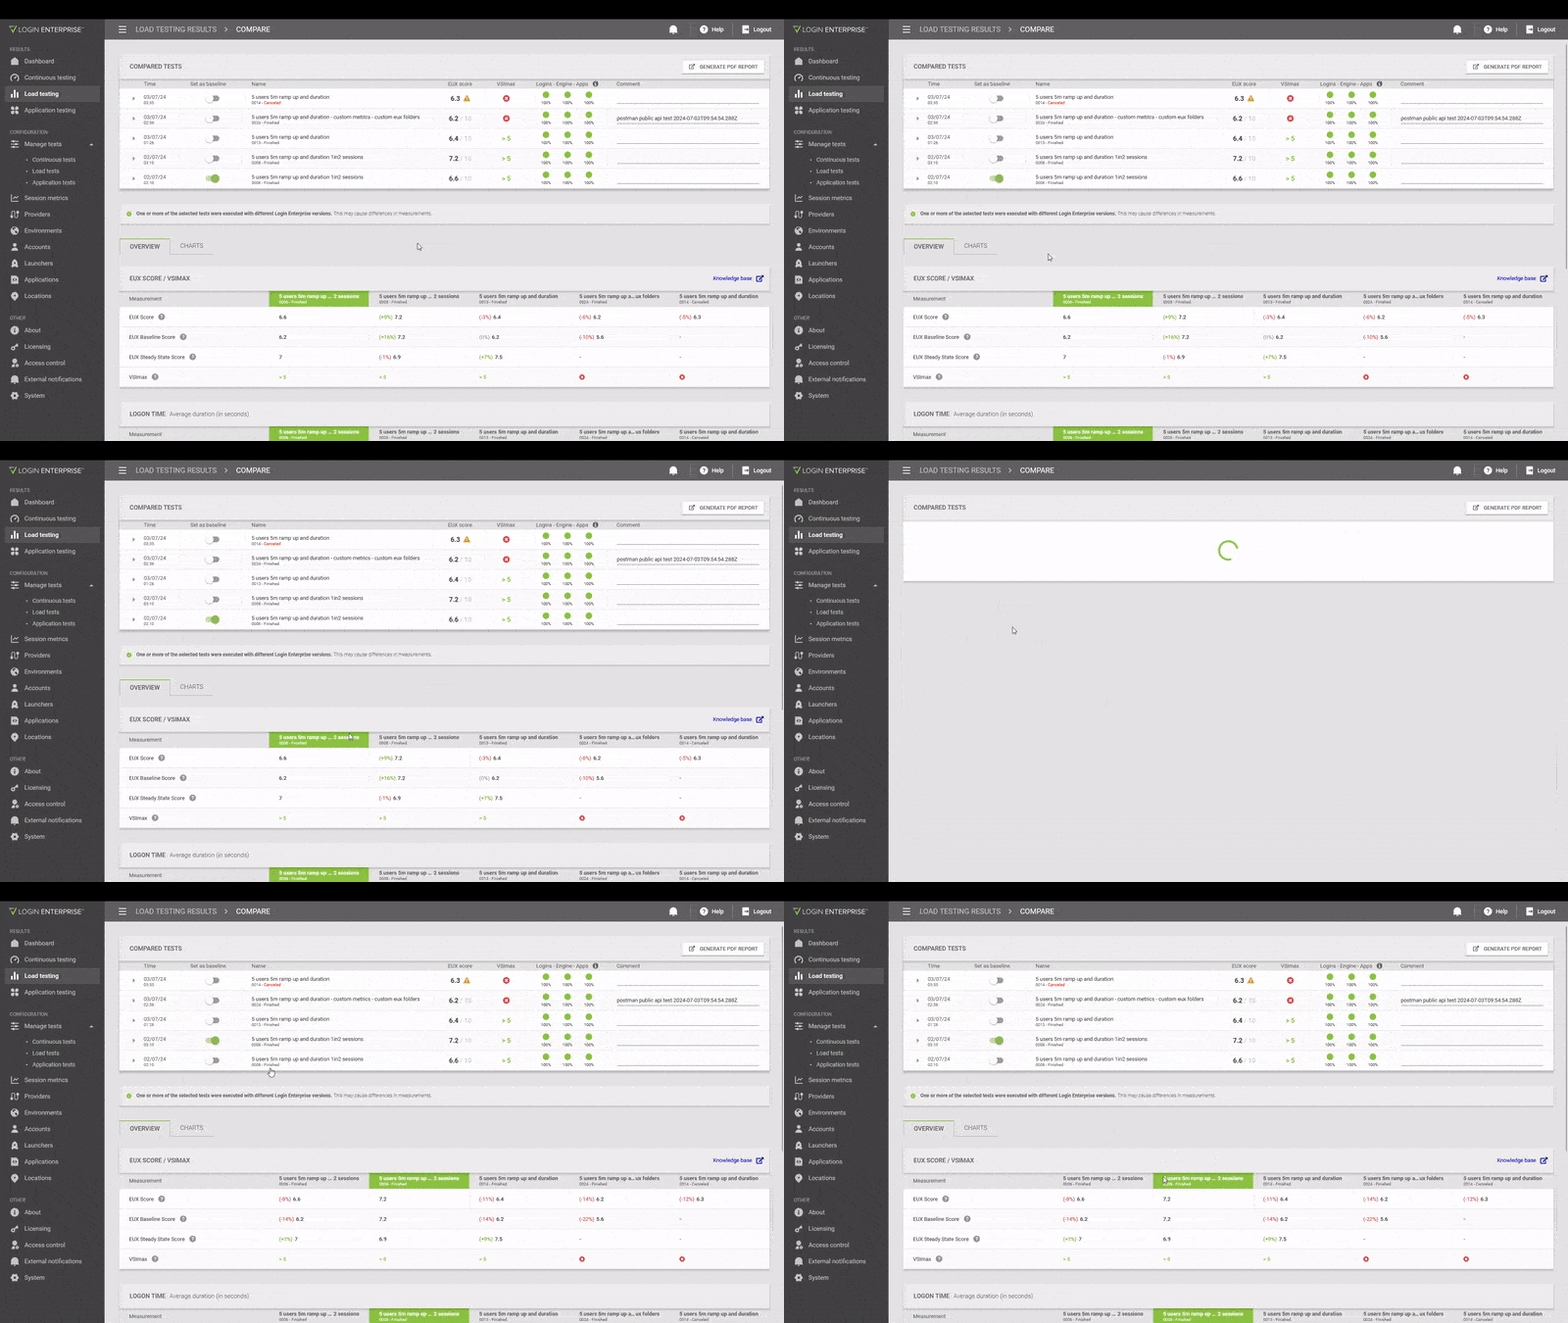
The overview page displays all selected tests with options to designate a baseline test. By default, the oldest test is the baseline, but you can change this to any of the selected tests. The green header denotes the selected baseline test. Parenthetical percentage deviations indicate performance deviations for better or worse. The baseline test serves as the reference point, and the other tests are compared against it.
You can toggle the baseline test via the “Set as baseline” column by clicking the slider corresponding to the test you want to set as the baseline. Once toggled, the corresponding column headers in the tables for the new baseline test will be green.
Here’s a GIF showing an example

Results Page
The results page is divided into several sections:
- Top Table: Displays all selected tests, highlighting the baseline test and showing percentage differences.
- EUX Score/VSImax Table: Shows results for end-user experience and maximum virtual session index.
- Logon Times Table: Breaks down the login process into measurable stages, providing detailed metrics.
- Application Response Time Table: Displays application performance metrics, focusing on those present in the baseline test.
Charts and Graphs
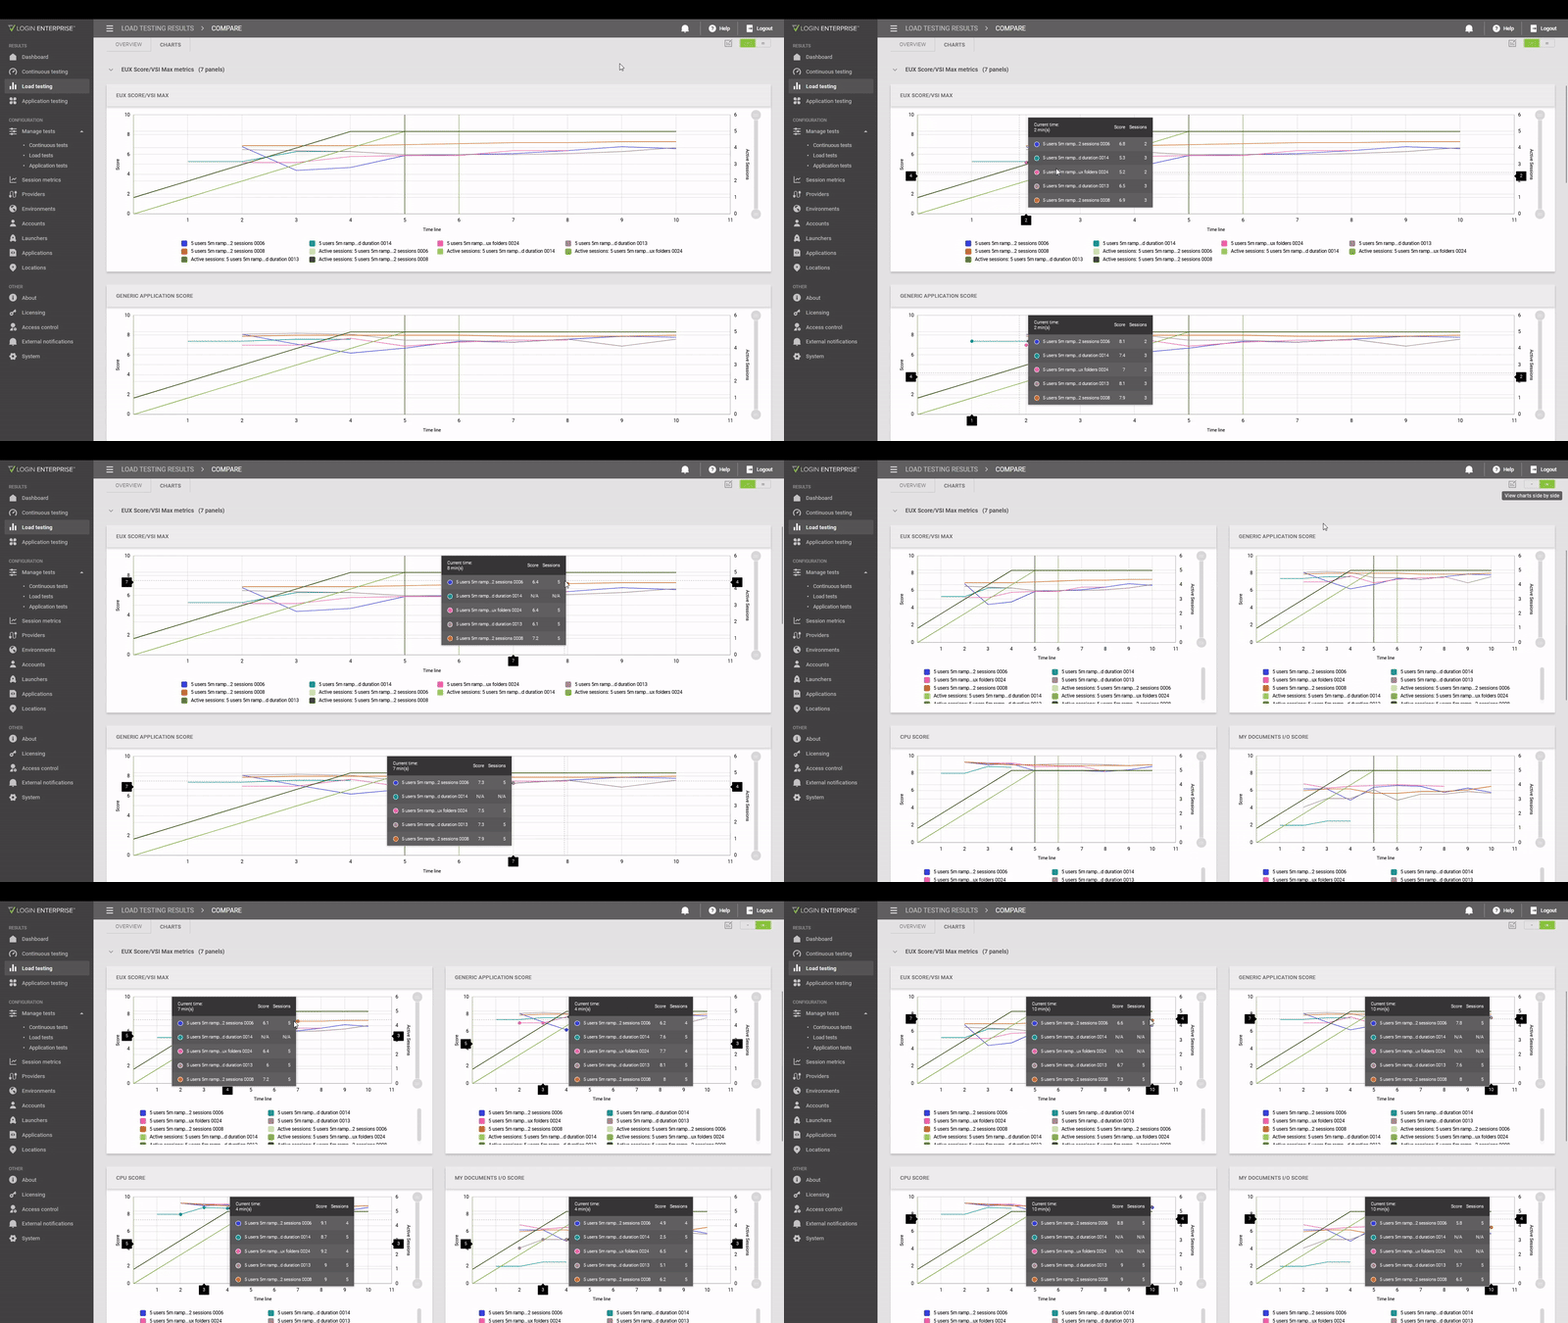
A dedicated charts tab allows you to visualize data across four expandable sections: End User Experience/VSImax metrics, Logins, Applications, and Session Metrics. You can customize the display to show one chart per row or two side-by-side, with interactive elements to highlight specific data points.
Click on the Charts tab to show the graphs for that category: EUX Score/VSI Max metrics, Logins, Applications, and Session metrics. These can be collapsed and expanded on demand.
By default, the view in Charts will show a window-wide view of the graphs (note the “-“ icon that’s selected by default)
However, if the “=” icon is clicked, this will display the charts side-by-side. Data points are hoverable in either view and will show tooltips in real time on each graph while being hovered over.
Here’s a GIF showing an example

PDF Report
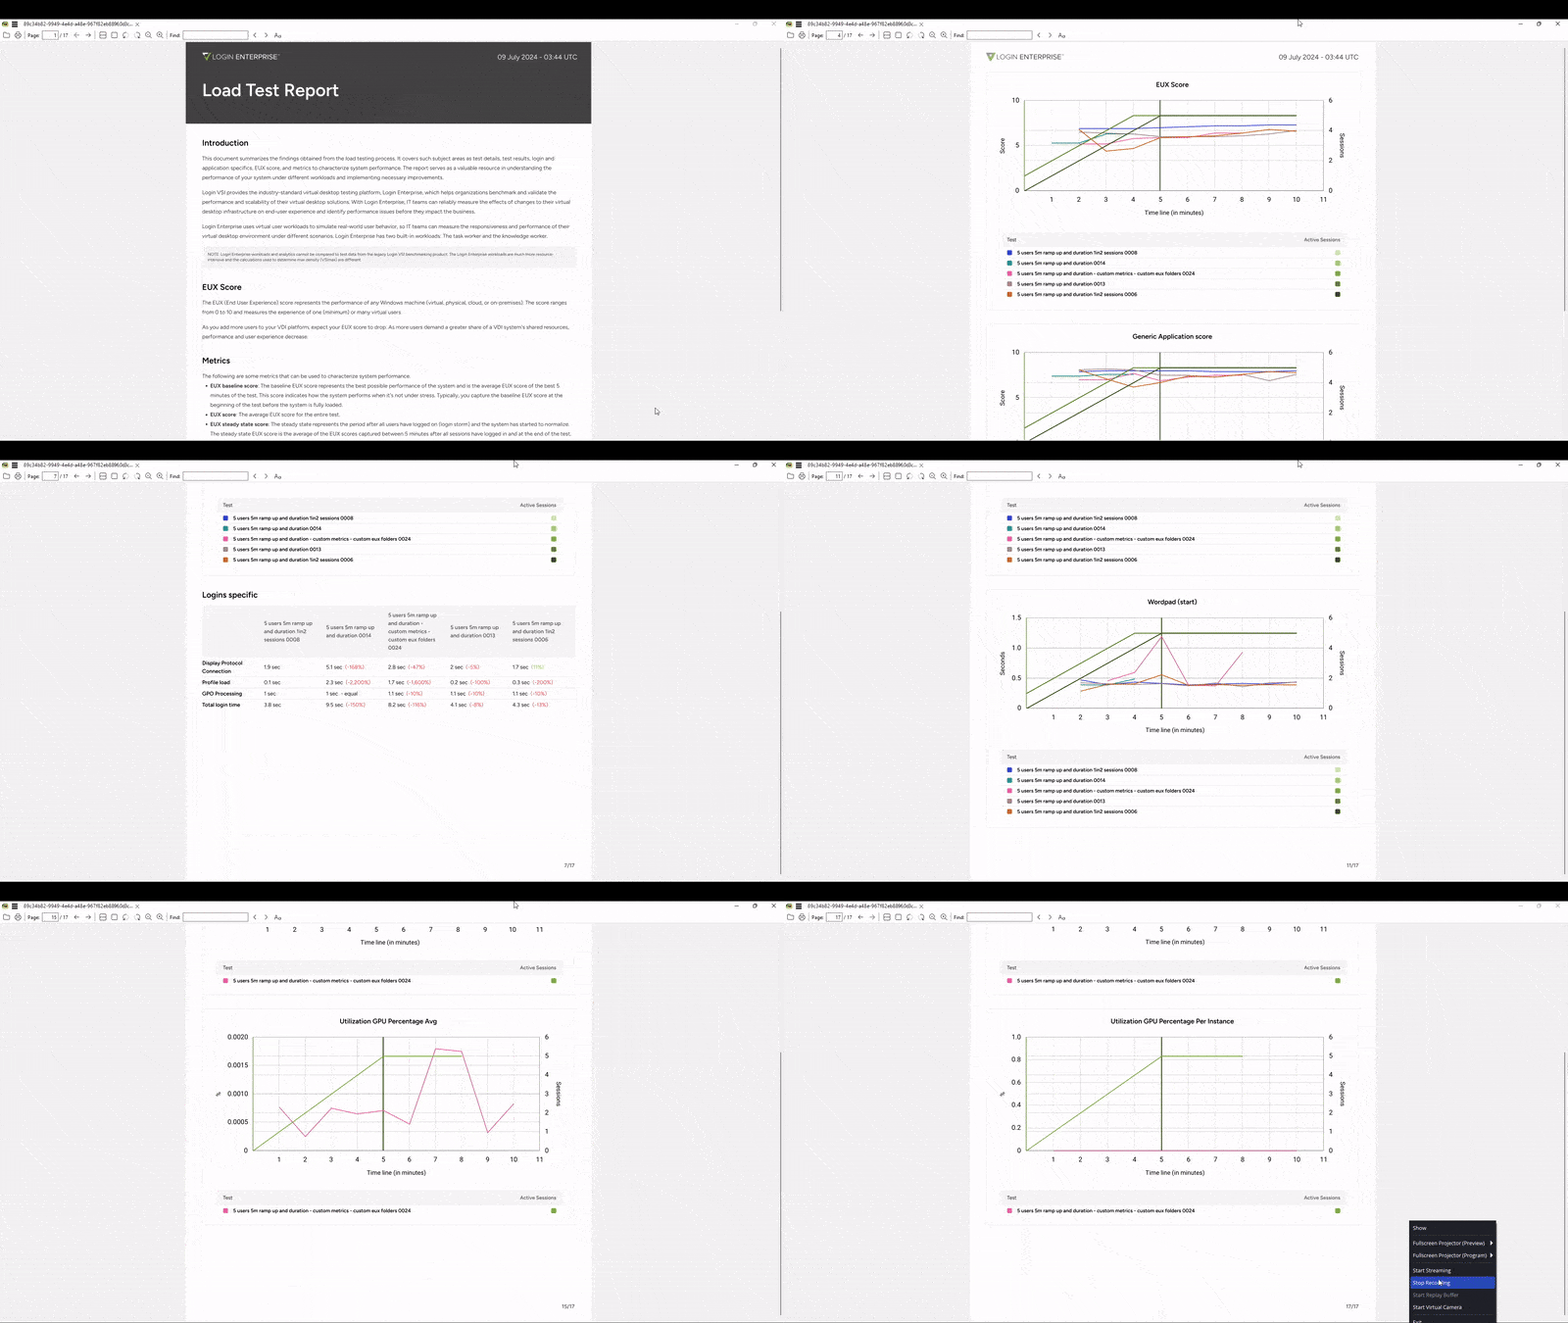
If the “Generate PDF Report” button is clicked, a popup will allow you to select the data you want in the PDF. Once selected, a PDF will be generated that can be saved, stored, reviewed, and archived for later review. This PDF can be distributed to stakeholders of the results and comparison. It is helpful to have a repository of Login Enterprise PDF load test comparison reports with filenames indicating what’s being compared.
Review this GIF to see an example of the layout and format of the up-to-5 load test comparison generated PDF

Additional Resources
For more information on how to effectively use these new features, check out our additional resources document to help you get the most out of your load testing and comparison capabilities.
Conclusion
By allowing the comparison of up to five load tests, this new feature in Login Enterprise 5.11 enhances your ability to analyze performance, make informed decisions, and optimize your IT infrastructure. Whether you’re testing for security updates, system configurations, or application performance, this tool will help you achieve more precise and actionable insights.
BenchmarksLogin Enterprise ReleaseProduct Release

